Series, like many other Chart elements, support a wide variety of appearances including the following:
- Gradient colors, with a variety of styles.
- Hatching, with a variety of patterns.
- Background images.
- Transparency, set using an alpha value.
Series are chart elements that store a
collection of related data points. Series store appearance properties
of their data points, and also have an associated chart type (i.e. chart
types are specified on a series basis). Each of the data points that belong to a series
has an X value and multiple Y values.
Microsoft Chart Control for .NET Framework can have an unlimited number of series, each of which can have an unlimited number of data points.
Series, like many other Chart elements, support a wide variety of appearances including the following:
- Gradient colors, with a variety of styles.
- Hatching, with a variety of patterns.
- Background images.
- Transparency, set using an alpha value.
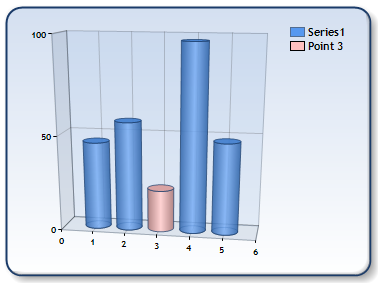
Series can have an unlimited number of data points, which also have their own appearance properties, such as gradient colors, hatching, and transparency. The appearance properties of a data point takes precedence over the same properties of the data point's owning series. The figure below demonstrates this granularity.
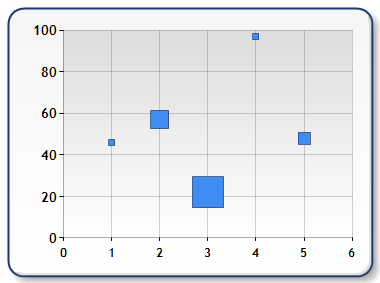
Multiple Y Values for Data Points
Each data point in a series consists of:
- an X value that may determine where a data point is plotted (the DataPoint.XValue property);
- and one or more Y values, which are the values of the data points (the DataPoint.YValues collection property).
Most chart types use one Y value. However, a few chart types require multiple Y values per point, such as Bubble, Candlestick, and Range chart types. The following figure shows the Bubble chart type, which requires two Y values.
Microsoft Chart Control for .NET Framework has many different chart types, and each chart type has a unique set of custom attributes associated with it. Furthermore, some custom attributes are specifically used with Series objects, while others are used with DataPoint objects. Some custom attributes can be used with both Series and DataPoint objects. See the Custom Attributes List topic in the product documentation for detailed information on each custom attribute.
Custom attributes are implemented via the CustomProperties property.
Series can be bound to a data source that has DateTime values, which can then be used for the series' X values. For more information, see the data binding samples.
There are numerous ways to manipulate data using the Chart control, such as filtering, grouping, merging, and splitting of data. There are also statistical and financial formulas. These data manipulations are usually performed on Series objects, and can result in the creation of new series, depending on the nature of the operations.
For more information, see the data manipulation samples.